Figure 26.1. The xxgdb main window.
| Previous | Table of Contents | Next |
xxgdb is an X Window system-based graphical user interface to gdb. All of the features that exist in the command-line version of gdb are present in xxgdb. xxgdb enables you to perform many of the most commonly used gdb commands by pressing buttons instead of typing in commands. It also graphically represents where breakpoints have been placed.
Start xxgdb by typing the following into an Xterm window.
xxgdb
When we initiate xxgdb, we can specify any of the command-line options that were available with gdb. xxgdb also has some of its own command-line options. These are described in Table 26.2.
| Option | Description | |
|---|---|---|
| db_name | Specifies the name of the debugger to be used. The default is gdb. | |
| db_prompt | Specifies the debugger prompt. The default is gdb. | |
| gdbinit | Specifies the filename of the initial gdb command file. The default is .gdbinit. | |
| nx | Tells xxgdb not to execute the .gdbinit file. | |
| bigicon | Uses a large icon size for the xxgdb icon. | |
When you start xxgdb, a window opens on your screen. This window is shown in Figure 26.1.

Figure 26.1. The xxgdb main window.
The xxgdb main window contains a message that is similar to the one displayed on the screen when the command line version of gdbis started. Near the bottom of the xxgdb main window there are four buttons. The Source Listing, Command Buttons, and Display Window buttons each bring up an additional window when they are activated. The Quit button terminates the xxgdb program.
The Source Listing button brings up a window that displays the source code for the program that is being debugged. This window is shown in Figure 26.2.

Figure 26.2. The xxgdb source listing window.
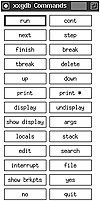
The Command Buttons button brings up a window that contains 26 other buttons. These buttons each execute a gdb command. The gdb command-button window is illustrated in Figure 26.3.

Figure 26.3. The xxgdb command-button window.
The Display Window button brings up a window that is used to display the results of any display command. You can tell xxgdb which variable or expression to display by selecting it from the source listing and then clicking on the Display button in the command-button window. The display window is illustrated in Figure 26.4.

Figure 26.4. The xxgdb display window.
For more information on using xxgdb, refer to the xxgdb man page and the gdb man page.
calls is a program that is not included on the Linux CD-ROM accompanying this book, but you can obtain a copy from the sunsite FTP site under the directory /pub/Linux/devel/lang/c/calls.tar.Z. Some older CD-ROM distributions of Linux include this file. Because it is a useful tool, we will cover it here. If you think it will be of use to you, obtain a copy from an FTP or BBS site or another CD-ROM. calls runs the GCC preprocessor on the files that are passed to it on the command line and displays a function call tree for the functions that are in those files.
Tip:
To install calls on your system, perform the following steps while you are logged in as root:
- 1. Uncompress and untar the file.
- 2. cd into the calls subdirectory that was created by the untar command.
- 3. Move the file named calls to the /usr/bin directory.
- 4. Move the file named calls.1 to the /usr/man/man1 directory.
- 5. Remove the /tmp/calls directory.
This will install the calls program and man page on your system.
When calls prints out the call trace, it includes the filename in which the function is found in brackets after the function name.
main [test.c]
If the function is not in one of the files passed to calls, it does not know where that function lives and only prints the function name.
printf
calls also makes note of recursive and static functions in its output. Recursive functions are represented in the following way:
fact <<< recursive in factorial.c >>>
Static functions are represented as follows:
total [static in calculate.c]
As an example, assume that calls were executed with the following program as input:
##include <stdio.h>


main ()

{

char my_string[] = “hello there”;

my_print (my_string);

my_print2(my_string);

}


my_print (char *string)

{

printf (“The string is %s\n”, string);

}


my_print2 (char *string)

{

  char *string2;

  int size, size2, i;


  size = strlen (string);

  size2 = size -1;

  string2 = (char *) malloc (size + 1);

  for (i = 0; i < size; i++)

    string2[size2 - i] = string[i];

  string2[size] = ’\0’;

  printf (“The string printed backward is %s\n”, string2);

}
This generates the following output:
  1 main [test.c]

  2       my_print [test.c]

  3             printf

  4       my_print2 [test.c]

  5             strlen

  6             malloc

  7             printf
calls recognizes a number of command-line options that enable you to specify the appearance of the output and which function calls get displayed. For more information on these command-line options, refer to the calls man page or enter calls -h at the command line.
| Previous | Table of Contents | Next |